


changing FFT resolution of known sweep signal leads to unexplained spectrum
Hi All,
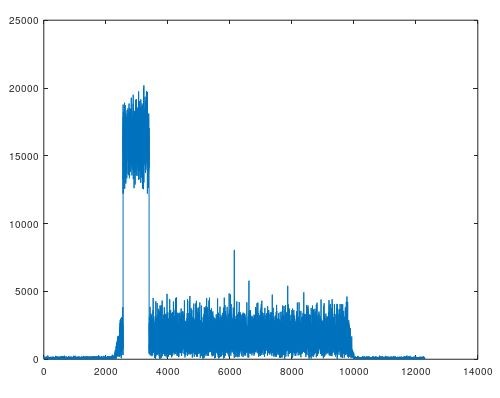
Below is fft of a sweep signal “x” which is 1.08MHz wide at edge of otherwise empty LTE 10MHz bandwidth.
The sweep range is -4.5MHz ~ -3.42, with 839 tones at resolution of 1.25KHz each (plus guardband of 13 zeros on left, 12 zeros on right), time domain must be 12288 samples.
plot(abs(fftshift(fft(x(1:12288))))); This is correct case and gives 1.25KHz resolution
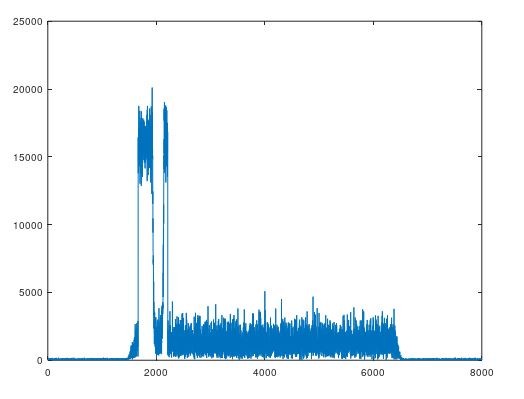
During testing I noticed that if I use fewer time domain samples I get unexplained differences of frequency domain: below is an example using 8000 samples instead of 12288. This means fft resolution is now more than tone resolution by 12288/8000 * 1.25KHz = 1.92KHz
I can’t explain why there is the below anomaly near centre of band.
It happened that our capture was initially 8000 samples and this shape led us to think that signal is wrong but I believe it was just misleading because as we went to 12288 samples all looked ok.
plot(abs(fftshift(fft(x(1:8000)))));
Any thoughts on my conclusion.
here is the octave file data (I Q) if it helps.
Read more here: Source link